|
a. The degrees of freedom used in this exercise were 6.
c. The chi-squared value is 40.06 d. The number was significant, meaning that it was not by chance. The wooly worms were clumped up in obvious areas so they were easy to capture. e. Worms that were colored shades of green should have positive selection in grassy areas. Being bright colored would be a negative selection pressure. f. This wooly worm population would most likely evolve to be shades of green rather than bright colored. g. The birds would be more likely to prey on brightly colored, larger worms. Those that are more able to camouflage with the environment are less likely to be chosen by the birds. h. The worms would be most likely to evolve to shades of green. Some of them may also evolve to be shades of brown because of the dirt patched that are present on the school grounds.
0 Comments
Post-lab Questions
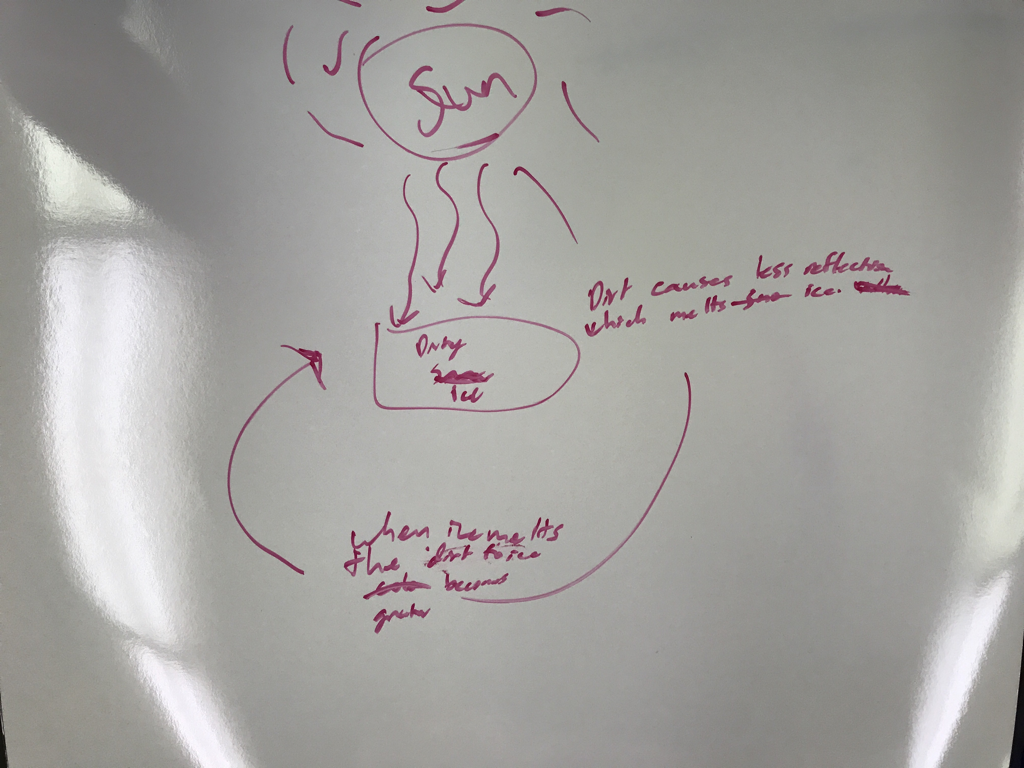 This is a possible feedback loop for dirty ice. 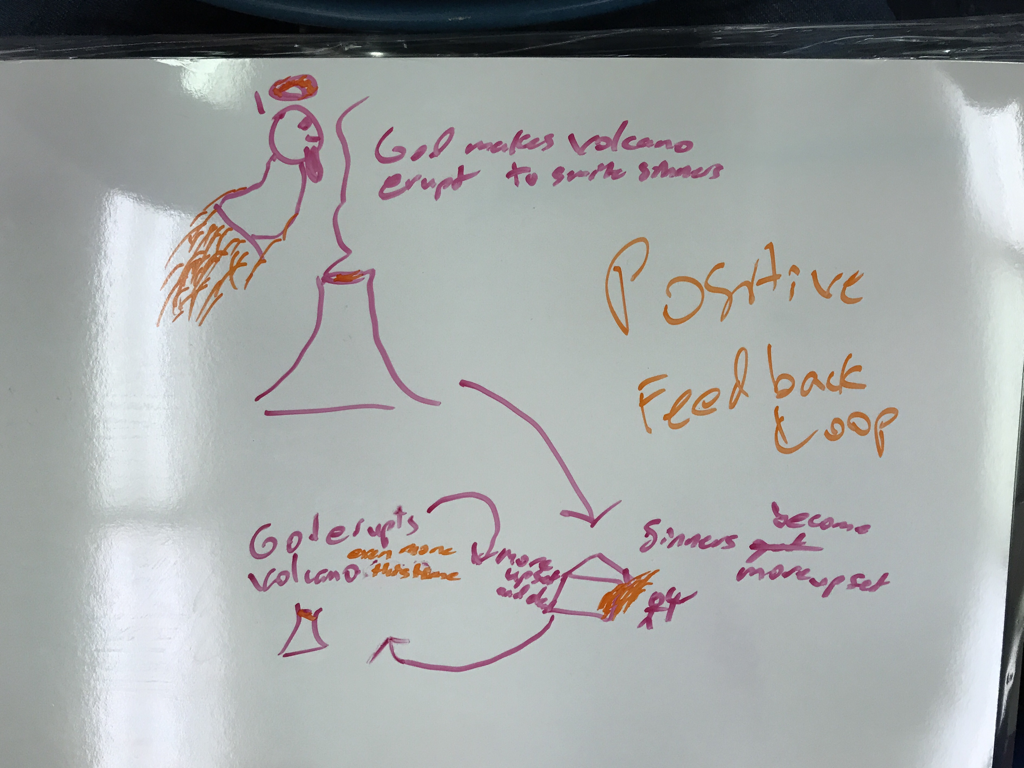 This is a possible feedback loop for volcanic eruption. 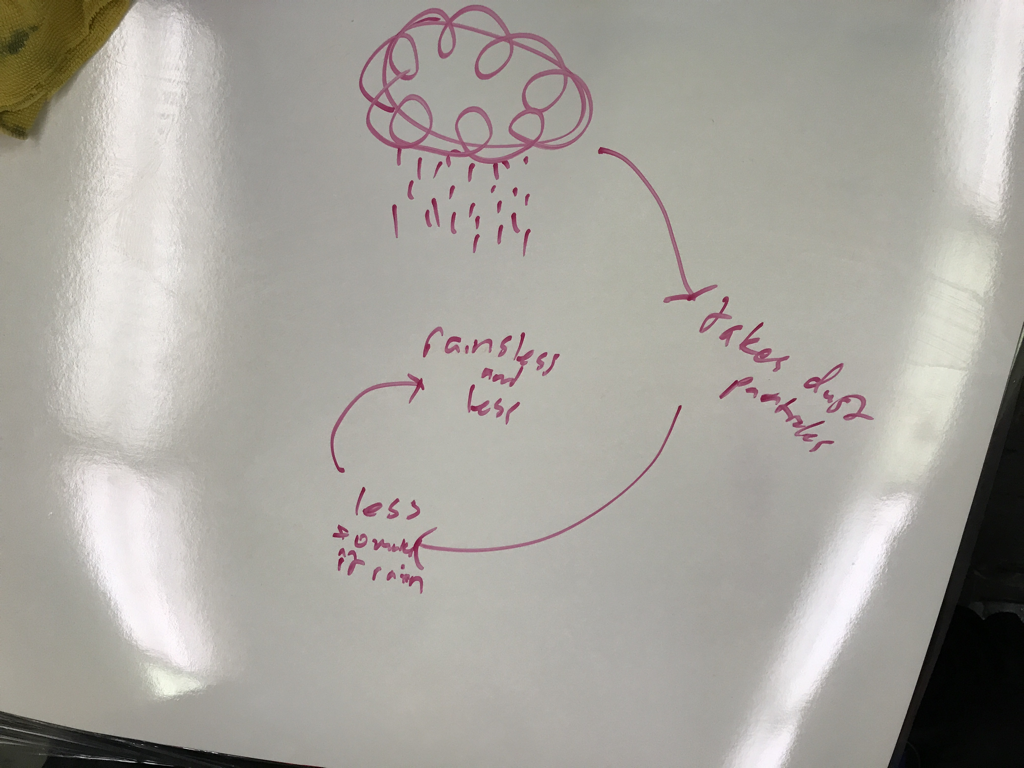 This is a possible feedback loop for rainy/cloudy day.
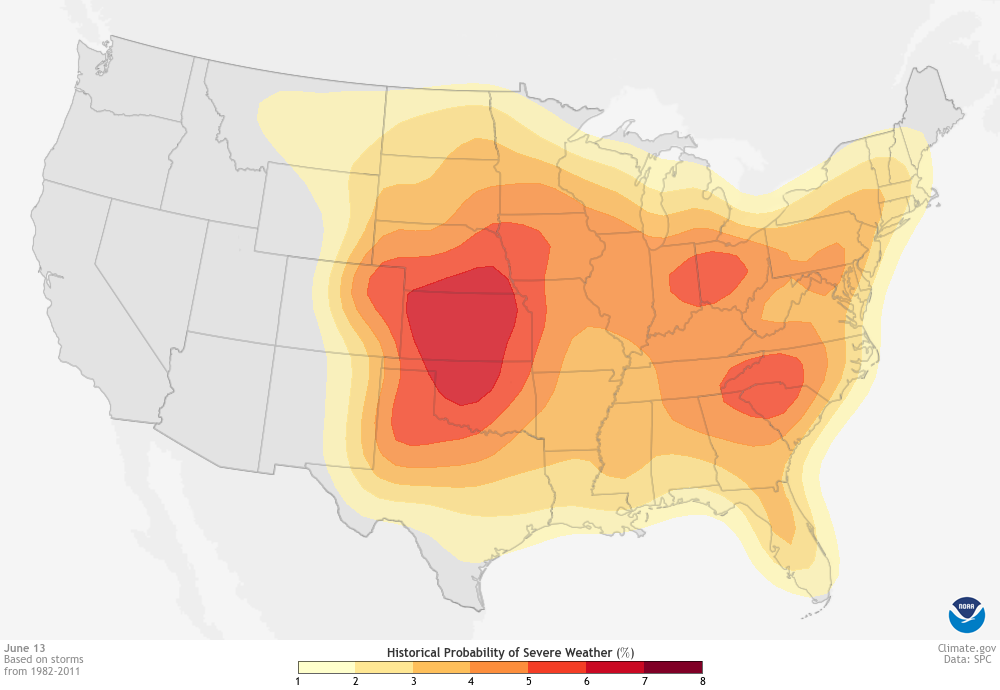 This map shows the probability of severe weather during June 13th based on storms from 1982 to 2011. This is interesting considering that these June is among the hottest months so I would not expect there to be much probability of storms. 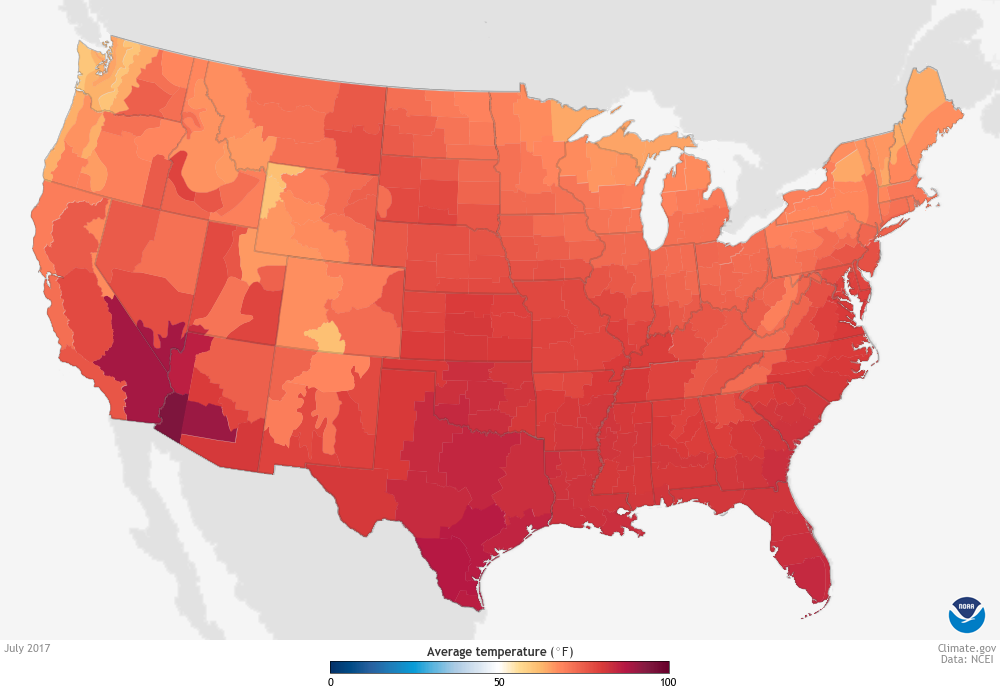 This map is an average monthly temperature map from July 2017. Here it can be seen how much the temperature has increased from 2000. There is more dark red and less yellows and oranges, showing that the temperature is increasing. 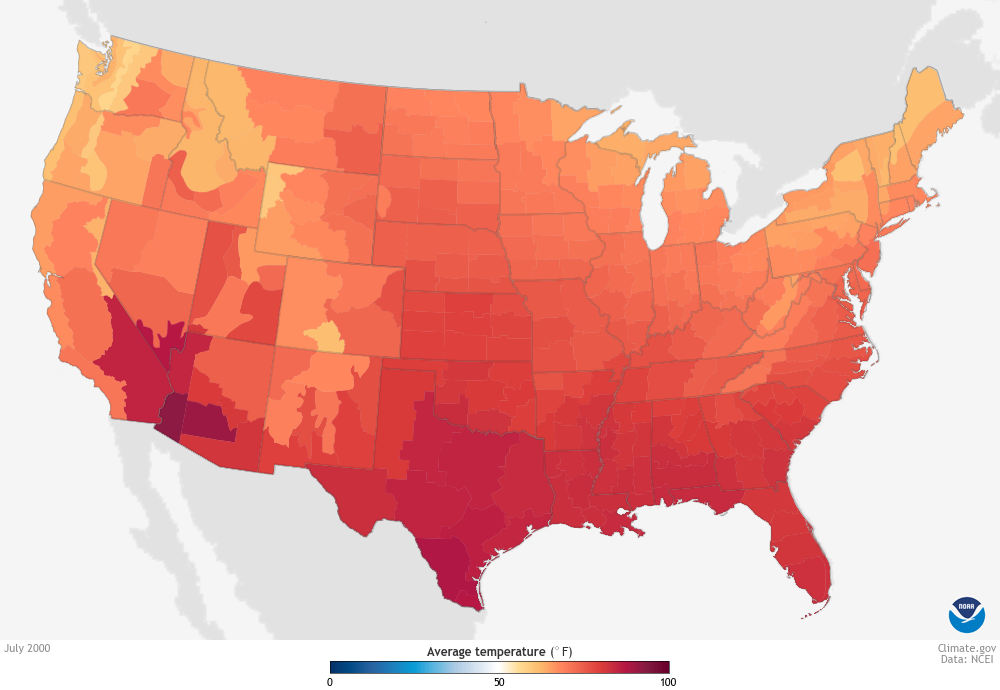 This is an average monthly temperature map from July 2000. The temperatures seem relatively normal as this is during the summer months. 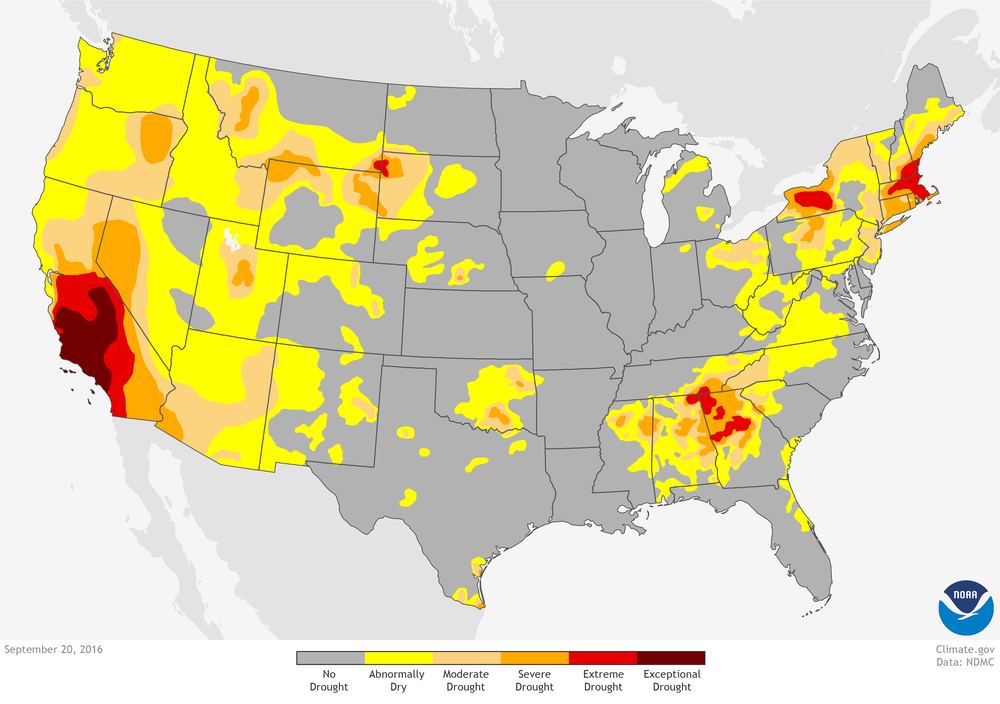 This map shows that drought levels dramatically decreased in just one year. This map is from September 2016. 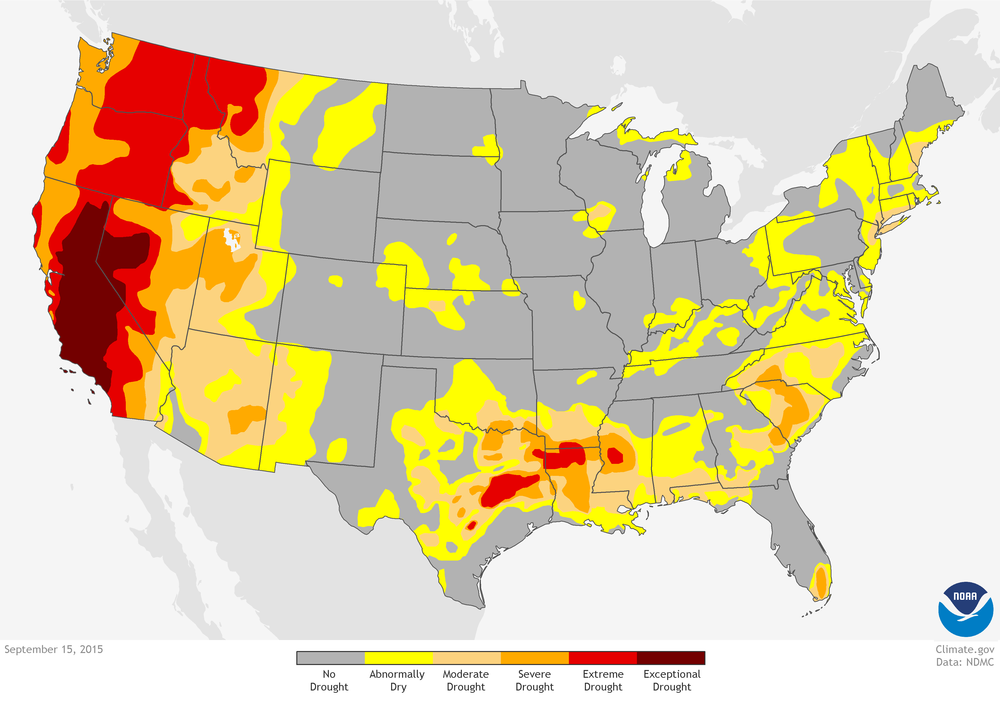 This is the drought level of the United States in September 2015. Massive drought levels can be seen in California as this was while drought levels were at all time highs.
Below are the population pyramids of seven cities throughout the United States.
As observed by the population pyramid of Turlock, its population is stable because of the somewhat equal percentages of the groups. Turlock's population will most likely stay the same in terms of population size.
This pyramid is constrictive. The percentage of younger people is lower than that of older people. The population of Buford will most likely decrease.
Delhi's population is relatively stable because of relatively similar percentages of the groups. Delhi's population may increase slightly.
Detroit's population is relatively stable because of the similar group percentages. Detroit's population may increase slightly in the future because of the smaller groups at the top groups.
The population may be stable because of the relatively similar sized groups. The population may remain similar to what it is not in the future.
The population of Los Angeles is increasing slowly because of the smaller size of the older groups and the growing size of younger groups. The population may increase in the future.
The pyramid for San Francisco is Constrictive as seen from the smaller sizes of younger groups and older groups. SF's population will most likely decrease because of this.
|
